Creating concise phenotype files for patients in PMBB
Published:
In this posting, I created a script in R that goes through the 3 most important phenotype files in PMBB.
These files contain information for:
- Patient demographics and covariates
- Demographics include Age, Gender
- Covariates are “Principal Components” discussed earlier. These are vectors with a magnitude according to 10 components based on exome sequencing, and 10 components based on genome sequencing
- Patient BMI
- Patient smoking history
In this R script, I basically take all the above information and combine it into something useful.
- Many of the files contain unnecessary columns
- So I removed them
- For patient BMI, each patient has multiple BMIs recorded for each hospital or office visit
- I take the mean BMI of all recordings, so I only include 1 BMI which summarizes overall BMI over time
- For smoking history, the data listed includes “Never”, “Quit” or “Current” smoking status, smoking quantity, smoking duration, and quit date, with multiple versions for each encounter data was modified
- I take only the most recent encounter data, as this is the information that is most up to date
- I summarize smoking quantity and duration into a single number, which is the “Pack-Year-History”
- For those unfamiliar, this is quantity smoked in packs multiplied by years smoked
- E.g. 2 packs a day for 30 years = 60 Pack-Year-History
- E.g. A never smoker has a 0 Pack-Year-History
- Of note, I remove patients who don’t have quantified information on their smoking history. Of the ~20,000 smokers, this removes approximately 10,000
- I also create a new column which evaluates “Yes” or “No”, is the patient recommended for lung cancer screening by low-dose chest CT scan? I.e, do they fit the criteria:
- Age 50-80
- 20+ pack-year smoking history
- Current smoker or smoker who quit <15 years ago
Overall, this creates a file which I think is very useful, as it contains pertinent patient information with columns for each patient phenotype
- PMBB_ID
- Year of birth
- Gender
- ePC1-10: 10 columns each denoting the principal component vector for exome data #1-10
- gPC1-10: 10 columns each denoting the principal component vector for genome data #1-10
- Pack-year-smoking-history
- Eligible for low dose chest CT for lung cancer screening?
- BMI
This file will be used in the OC_build_PRS.Rscript, and will be the basis of control variables when building Polygenic Risk Scores.
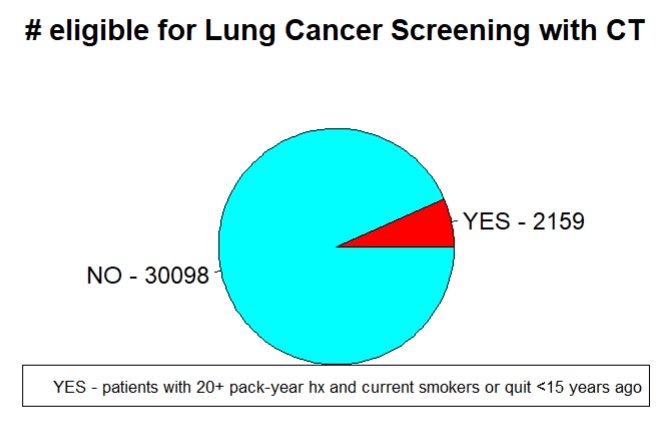
At the end, I create a pie chart to visualize the patients who would be recommended for Lung Cancer screening.

#!/usr/bin/env Rscript

####
# Code to make a text file containing important info to input into PRS scores
# This code should output a file that contains the following columns
  # PMBB_ID
  # Year of Birth
  # Gender
  # ePC1-10: 10 columns each denoting the principal component vector for exome data #1-10
  # gPC1-10: 10 columns each denoting the principal component vector for genome data #1-10
  # Pack-year-smoking-history
  # Eligible for low dose chest CT for lung cancer screening?
  # BMI

# Load phenotypes files, this was from phenotypes 2.1 in PMBB
covariates <- read.csv(file= "G://My Drive//Work//Research//Maxwell//phenotypes//PMBB-Release-2020-2.1_phenotype_covariates.txt", header = T, sep="\t")
tobacco <- read.csv(file= "G://My Drive//Work//Research//Maxwell//phenotypes//PMBB-Release-2020-2.1_phenotype_smoking-history.txt", header = T, sep="\t")
bmi <- read.csv(file= "G://My Drive//Work//Research//Maxwell//phenotypes//PMBB-Release-2020-2.1_phenotype_vitals-BMI.txt", header = T, sep="\t")

# Covariates
# Only pull out the sex, birth year, and principal components of each patient
covariates <- covariates[,-c(4)]

# BMI
# Calculate the average patient BMI over all encounters
bmi <- aggregate(bmi$BMI, list(bmi$PMBB_ID), FUN=mean)
colnames(bmi) <- c("PMBB_ID", "BMI")

# Tobacco
# Only pull out the most recent encounter for each patient
tobacco <- as.data.table(tobacco)
tobacco <- tobacco[tobacco[, .I[ENC_DT_SHIFT == max(ENC_DT_SHIFT)], by=PMBB_ID]$V1]

# Make a data frame with never smokers only, 2nd column is their pack year history of 0
never_smokers <- data.frame(PMBB_ID=tobacco[which(tobacco$SOCIAL_HISTORY_USE=="Never"),c(1)],PACK_YR_HX=0, CT_ELIGIBLE="NO")

# Subset data frame to ever smokers
ever_smokers <- tobacco[-which(tobacco$SOCIAL_HISTORY_USE=="Never"),]
# Remove smokers who don't have a listed duration of smoking
ever_smokers <- ever_smokers[-which(is.na(ever_smokers$USE_YEARS)),]
# Remove smokers who don't have a listed quantity of smoking
ever_smokers <- ever_smokers[-which(ever_smokers$USE_AMOUNT_PER_TIME==""),]
# Subset only important columns
ever_smokers <- ever_smokers[,c(1,3,5,6,7,8)]
# Calculate pack-year-smoking history
ever_smokers$YEARS = as.numeric(substr(ever_smokers$USE_AMOUNT_PER_TIME,1,nchar(ever_smokers$USE_AMOUNT_PER_TIME)-16))
ever_smokers$PACK_YR_HX = ever_smokers$USE_YEARS*ever_smokers$YEARS
# Create a column YES/NO on if the patient would be recommended for Chest CT screening already
  # >20 pack year history smoking
  # AND
  # Current smokers or quit <15 years ago
ever_smokers$CT_ELIGIBLE = "YES"
ever_smokers$CT_ELIGIBLE[which(ever_smokers$PACK_YR_HX<=20)] = "NO"
ever_smokers$CT_ELIGIBLE[which(ever_smokers$USE_QUIT_DATE_SHIFT<"2007-05-21")] = "NO"
# Subset important columns
ever_smokers <- ever_smokers[,c(1,8,9)]

# Combine never and ever smoker data frames, merge with covariates and bmi
tobacco <- rbind(never_smokers, ever_smokers)
covariates_tobacco <- merge(covariates,tobacco, by="PMBB_ID")
covariates_tobacco_BMI <- merge(covariates_tobacco,bmi, by="PMBB_ID")

# Fix patients CT_ELIGIBLE according to age - make "NO" if age >80 or <50
covariates_tobacco_BMI$CT_ELIGIBLE[which(covariates_tobacco_BMI$BIRTH_YEAR<1942)] = "NO"
covariates_tobacco_BMI$CT_ELIGIBLE[which(covariates_tobacco_BMI$BIRTH_YEAR>1972)] = "NO"

# Plot how many are CT eligible, just for fun

# 3D Exploded Pie Chart
library(plotrix)
slices <- c(length(which(covariates_tobacco_BMI$CT_ELIGIBLE=="YES")), length(which(covariates_tobacco_BMI$CT_ELIGIBLE=="NO")))
lbls <- c(paste("YES -",slices[1]), paste("NO -",slices[2]))
pie(slices,labels=lbls,main="# eligible for Lung Cancer Screening with CT",col=rainbow(2))
legend("bottom", "YES - patients with 20+ pack-year hx and current smokers or quit <15 years ago", cex=0.7)

# Save covariates file
write.table(covariates_tobacco_BMI , "G://My Drive//Work//Research//Maxwell//phenotypes//OC_covariate_file.txt", row.names = FALSE, sep="\t", quote = FALSE)
