Genotype Imputation and TOPMed r2
Published:
I have never understood genotype imputation. This blog post serves to describe the concept of genetic imputation and how it’s carried out using TOPMed.
Concept of genetic imputation:
Genetic imputation refers to the inference of unobserved genetic data. Put simply, it is when we estimate missing data.
We don’t evaluate the entire genome. Instead, we evaluate the genome through single nucleotide polymorphism (SNP) sites. For example, Penn Medicine Biobank implements Illumina “Global Screening Array” microchips which sample approximately ~627,168 SNPs across the entire genome.
Although this sounds like a lot, it’s not. The human genome consists of approximately 3.2 Billion nucleotides. This means that an Illumina GSA V2 chip will evaluate 627,168/3,200,000,000=0.02% of the human genome. This converts to measuring 1 of every 5,000 nucleotides.
Why don’t we just sequence the entire genome?
- Sequencing the whole genome of each individual in the study is often too costly, so only a subset of the genome can be measured
- Not everyone has the technology to sequence the entire genome - many platforms only evaluate specific parts, such as the Illumina sequencing above
So, we haven’t analyzed the entire genome. Instead, we analyzed 1 of every 5,000 nucleotides. Now what?
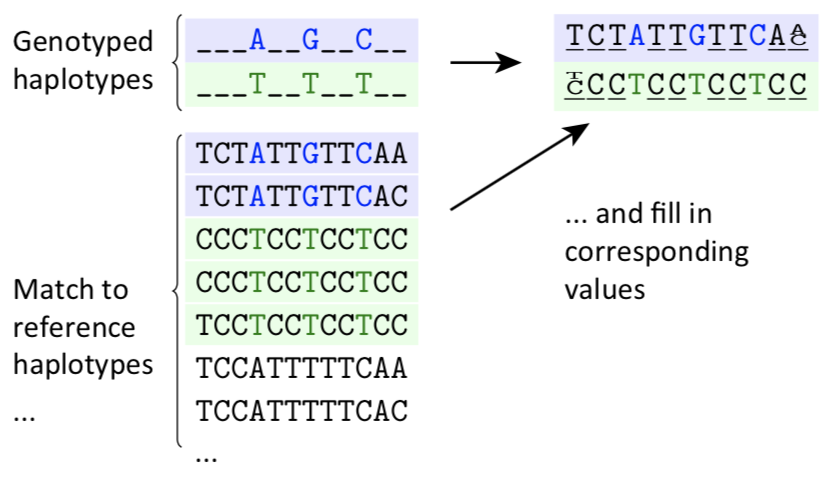
Next, we can use imputation to estimate the sequence that goes in between our 1 of every 5,000 nucleotides. Below is a visual representation of what this woulud entail. As you can see, the top line found the nucleotides A..G..C, without knowing what was in between. We then compare this to reference sequences. We can look through and see that only 2 of the reference sequences have the same pattern of A..G..C. Both are the same and we can therefore fill in the missing data points.

So, we have SNPs already. Why do we need to perform genetic imputation? Why can’t we just use the SNPs?
Genotype imputation is a key component of genetic association studies. It can:
- Increase power
- Can provide genetic information in between the 600k evaluated SNPs, providing more datapoints
- Facilitate meta-analysis
- If other microarray platforms are used (with different SNPs), imputation can convert data into a single format
- Aids interpretation of signals
What is TOPMed?
Essentially, TOPMed (Trans-Omics for Precision Medicine) is a panel of the above reference genomes, also known as “reference haplotypes”. They describe them as ~97,000 “deeply sequenced human genomes”.
The panel is available to the community through a collaboration between TOPMed Study Investigators, the National Heart Lung and Blood Institute and the University of Michigan Imputation Server team.
In Penn Medicine Biobank, we implemented “TOPMed r2”, which uses version r2 of the panel. This is the first version available to the scientific community:
- 97,256 reference samples
- 308,107,085 genetic variants
Let’s go into way too much detail temporarily…
The charts and data on how TOPMed r2 genotype imputation works is absolutely phenomenal. I’ve copied a couple graphs from the papers involved to show the insane detail required to make this process work.
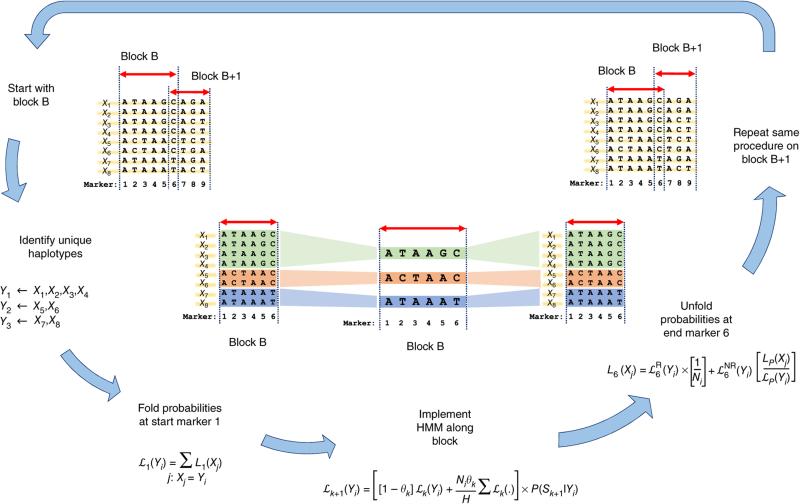
In the first, it looks like they’re using some kind of repeating algorithm to compare Marker “M” sequence at Block “B” to reference sequences “X1”…“X8”. After the sequence is complete, it loops to Block “B+1” and continues.

Overview of state space reduction. We consider a chromosome region with M = 9 markers and H = 8 haplotypes: X1, X2, …, X8. We break the region into consecutive genomic segments (blocks) and start by analyzing block B from marker 1 to marker 6. In block B, we identify U = 3 unique haplotypes: Y1, Y2, and Y3 (colored in green, red, and blue, respectively). Given we know the left probabilities of the original state space at marker 1 (that is, L1(X1), …, L1(X8)), we fold them to get the left probabilities of the reduced state space at marker 1: ℒ1(Y1), ℒ1(Y2), and ℒ1(Y3). We implement HMM on the reduced state space (Y1, Y2, and Y3) from marker 1 to marker 6 to get ℒ6(Y1), ℒ6(Y2), and ℒ6(Y3). We next unfold the left probabilities of the reduced state space at marker 6 to obtain the left probabilities of the original state space: L6(X1), …, L6(X8). We repeat this procedure on the next block, starting with L6(X1), …, L6(X8), to finally obtain L9(X1), …, L9(X8).
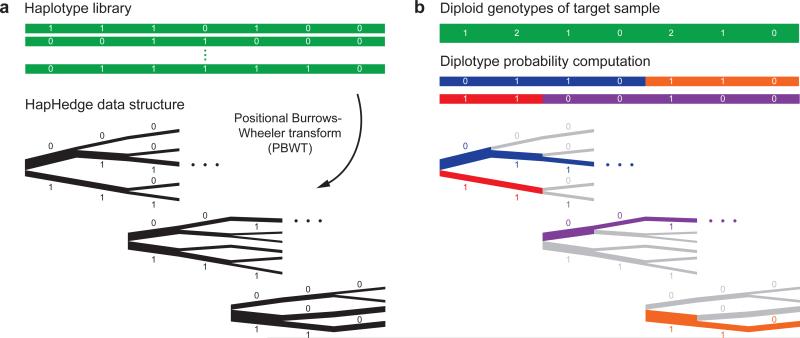
I’m not sure what’s happening in this next figure yet, but it uses an algorithm called “Eagle 2”

Schematic of the Eagle2 core phasing algorithm Given diploid genotypes from a target sample along with a haploid reference set of conditioning haplotypes, our algorithm proceeds in two steps. (a) We use the positional Burrows-Wheeler transform20 to generate a “hedge” of haplotype prefix trees rooted at markers spaced across the chromosome. These trees encode haplotype prefix frequencies, represented here with branch thicknesses. (b) We explore a small set of high-probability diplotypes (i.e., complementary pairs of phased haplotypes), estimating diplotype probabilities under a haplotype copying model by summing over possible recombination points. For each possible choice of recombination points, the HapHedge data structure allows rapid lookup of haplotype segment frequencies. (This illustration is meant to provide intuition for the overall approach; our optimized software implementation first “condenses” reference haplotypes based on the target genotypes. Details are provided in Supplementary Fig. 1 and the Supplementary Note.)
How to use TOPMed r2:
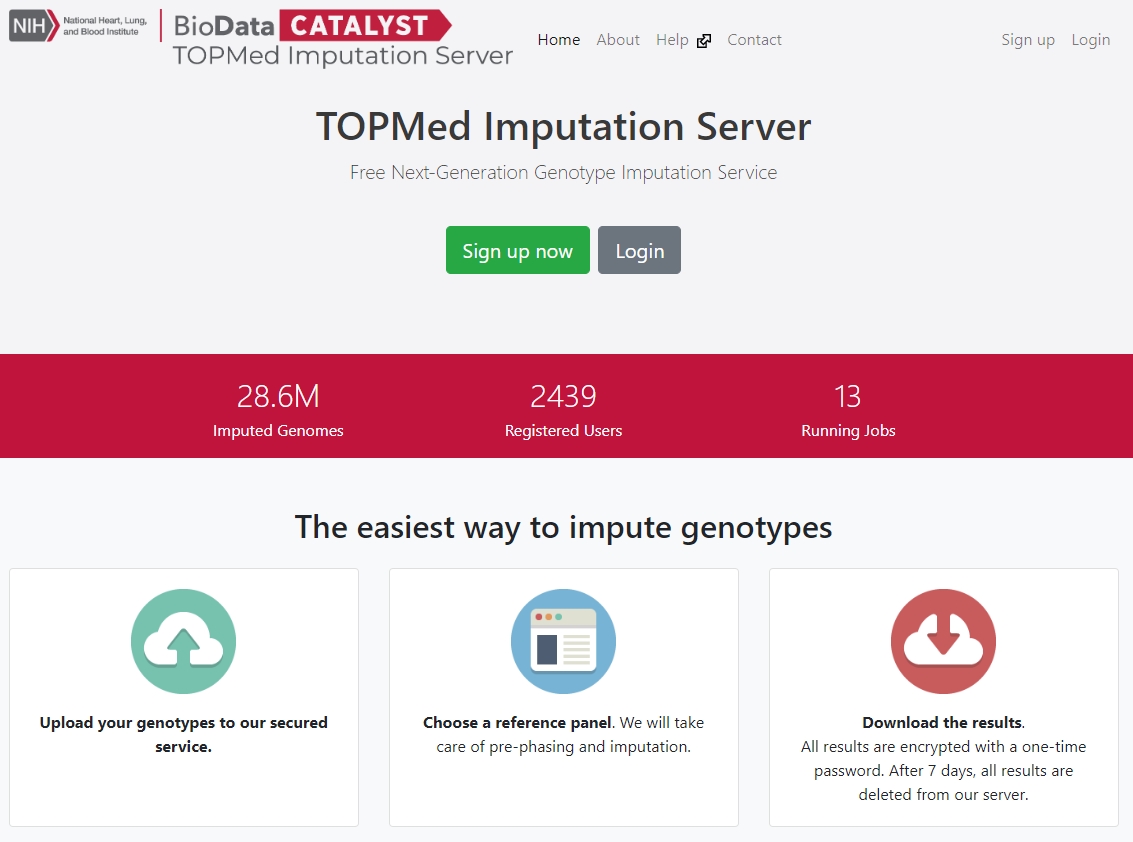
I’m not clear on how exactly the Penn Medicine Biobank completed their genotype imputation, however my best guess is that it was performed by using the TOPmed imputation website.
They have a beautiful homepage which explains how to initiate the process.

The end result that I see on the Penn Medicine Biobank are files in the “Imputed” directory which show .vcf files for each of the 23 chromosomes.
That’s it for today!
Sources for this blog post include:
