At atlas of genetic correlations across human diseases and traits… A review
Published:
In this posting, I’ll review an analytical paper in Nature genetics entitled “An atlas of genetic correlations across human disease and traits”, by Bulik-Sullivan et al. published 2015. It can be found here on Nature’s website and here on PubMed.
Background
Previously, it has been difficult to estimate genetic correlations between complex traits and diseases using GWAS (Genome wide association studies). Why is this the case? This is because GWAS studies use statistics to identify a SNP that is really significantly associated with a trait or disease. But in traits such as height, or diseases such as asthma, there are many individual genes that each contribute a small aspect towards the phenotype. For these complex traits and diseases, our conventional statistics don’t work. They look for SNPs that obtain genome-wide significance (strongly correlated), but not all associated gene loci are found because many do not reach statistical significance.
This paper provides a new technique which enables estimating correlations between complex traits and diseases. This technique is referred to as cross-trait LD (Linkage disequilibrium) score regression.
The main benefit of this technique is that it may be applied when GWAS studies are available, but individual-level genotypic data is not. These genetic correlations are challenging to evaluate when GWAS studies group together genetic data. To contrast, when individual-level genetic data and phenotypes are available, the statistical tests that could be used are known as REstricted Maximum Likelihood (REML) and polygenic scores. These statistical techniques are discussed elsewhere.
Given that my research will mainly focus on the area of polygenic scores, I feel this paper will have less relevance to my research and I’ll only review this paper briefly.
PICOTS
PICOTS doesn’t really apply to this study. Instead, this study evaluates 24 GWAS, creates a new polygenic model for the expected value of correlation between complex traits and diseases, and then reports genetic correlations for 276 pairs of phenotypes.
Results
Equation 1 demonstrates the expected value for an associated complex trait/disease, with another. These are annoted as z1 and z2. N1 and N2 refer to the sample size for each study. l(j) refers to the LD (linkage disequilibrium) score. Ns refers to the number of individuals included in both studies. The other variables refer to cofactors related to genetic relatedness or correlations measured in the studies.
Of note, I don’t think it’s important to need to understand this equation. The supplemental materials provides an explanation for the derivative of the equation, and it’s 9 pages long!

Equation 1
The study calculates a genetic covariance using regression, using LD score and the traits/diseases, along this equation. The study then ran several simulations to estimate whether the model was effective, which showed the estimate and true values for each parameters were very similar. They then verified whether the model was effective by comparing the well-established REML (REstricted Maximum Likelihood) models with their model. Based on this, they created Figure 1.
The purpose of Figure 1 below is to demonstrate that the LDSC (LD scores) don’t differ from conventional REML scores. Within each category, LDSC bars are not significantly different to the REML bars.
.jpg)
Figure 1
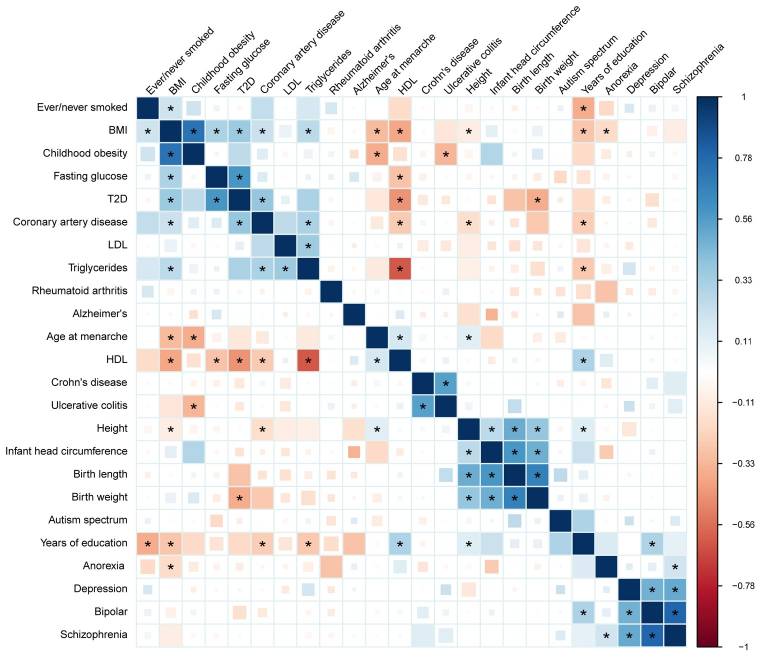
The purpose of Figure 2 (below) is to show that there are some complex traits and diseases that were significantly associated according to the cross-trait LD score regression. These links are marked with a black asterix. There are other illustrated findings such as the size of boxes or color, however I don’t think these are very impactful. The main finding is whether the traits/diseases are significantly correlated.

Figure 2
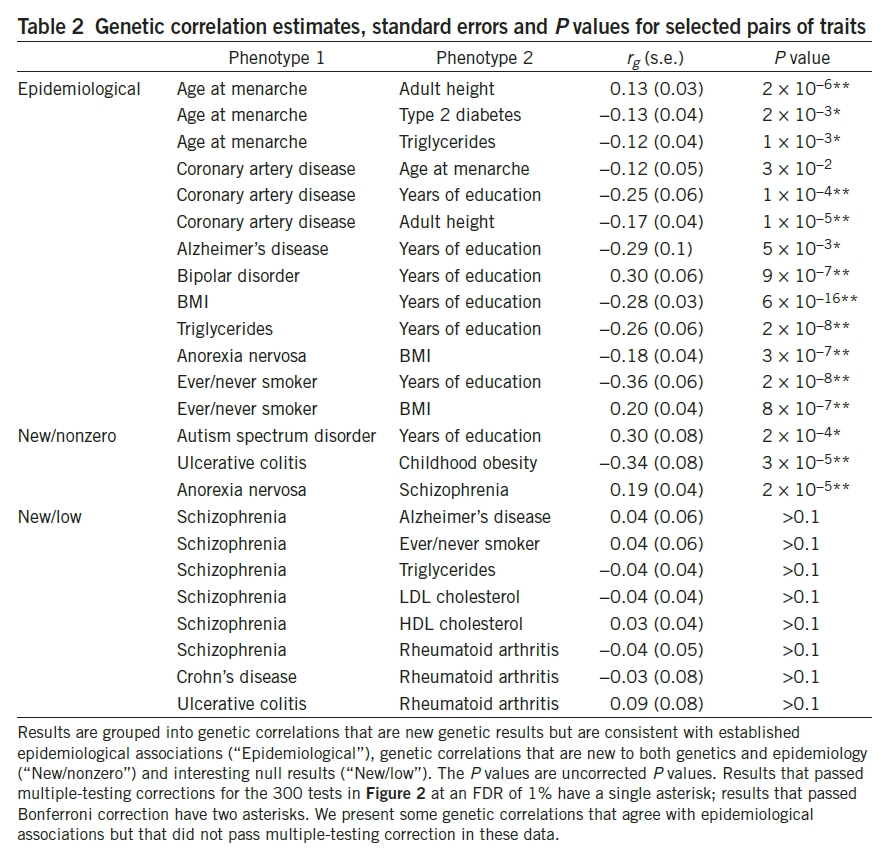
Table 2 takes the results from Figure 2 that have been reported in epidemiological studies, but haven’t been reported with genetic association. In addition to the two correlated traits/diseases, it lists r(g), which represents SNP genetic correlation. s.e. represents standard error. 
Table 2
Discussion and limitations
The study proposes that this new model, called the cross-trait LD (Linkage disequilibrium) score regression to estimate genetic correlation from GWAS statistics. When applying this model, the study found several new correlations, including links between anorexia nervosa and schizophrenia.
A limitation acknowledged in this study is genetic confounding. The authors describe this as when a gene is simultaneously leads to multiple effects. The example provided is when an association between HDL and CAD is drawn. This could be related to a causal pathway between HDL and CAD. However, it could also be genetic confounding, visually represented as HDL <- gene -> Triglycerides -> CAD. In this case, HDL is a byproduct of the gene, but not along the causal pathway.
Another limitation is that genetic correlation could be affected by misclassification.
The study acknowledges limitations for their specific model, including requirement for large sample sizes, unclear affects of mating, and optimal use in polygenic models (and not standard, single significant SNPs)
Take home points
The cross-trait LD (Linkage disequilibrium) score regression can estimate genetic correlation of complex traits and diseases from GWAS statistics, without the need for individual-level genotypic data.
