Large-scale association analysis identifies new lung cancer susceptibility… A review
Published:
In the upcoming days, I’m going to review background literature on the topic of my future research.
Today, I’m going to evaluate a paper published in June 2017 in Nature Genetics Entitled “Large-scale association analysis identifies new lung cancer susceptibility loci and heterogeneity in genetic susceptibility across histological subtypes”. It can be accessed at this link at Nature genetics and this link on PubMed.
Background
Genome-Wide Association Studies (GWAS) have previously identified lung cancer susceptiblity loci including CHRNA3, CHRNA5, TERT, HLA (Human Leukocyte Antigen) region, BRCA2 and CHEK2. However, much of the heritability for lung cancer remains unexplained.
PICOTS
This is a case-control study performed using existing study genotyping and outcome data.
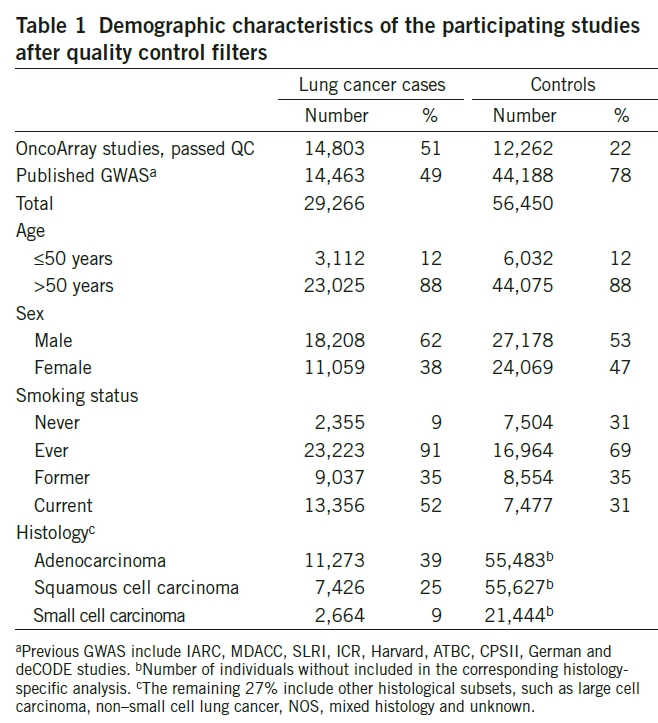
Population: Total 14,803 cases (with diagnosis of lung cancer) and 12,262 controls. These were taken from:
- ATBC study
- CAPUA study
- CARET study
- Canadian screening study
- Copenhagen study
- EAGLE study
- EPIC study
- Liverpool study
- German lung cancer study
- Kentucky lung cancer research initiative
- The Harvard lung cancer study
- Israel study (NICCC-LCA)
- MDACC study
- The Malmo Diet and Cancer Study
- The Multiethnic Cohort
- The Mount-Sinai Hospital-Princess Margaret Study (MSH-PMH)
- The New England Lung Cancer Study (NELCS)
- The Nijmegen Lung cancer study
- Norway study
- NSHDS study
- PLCO study
- Resolucent study
- IARC L2 study
- TLC study
- Washington State University Lung Cancer study
- The Vanderbilt lung cancer study (BioVU)

Intervention: Patients underwent genotyping with OncoArray genotype
Comparator: Patients with and without lung cancer
Outcome: Association of individual loci with lung cancer
Setting and Timing: N/A
Results
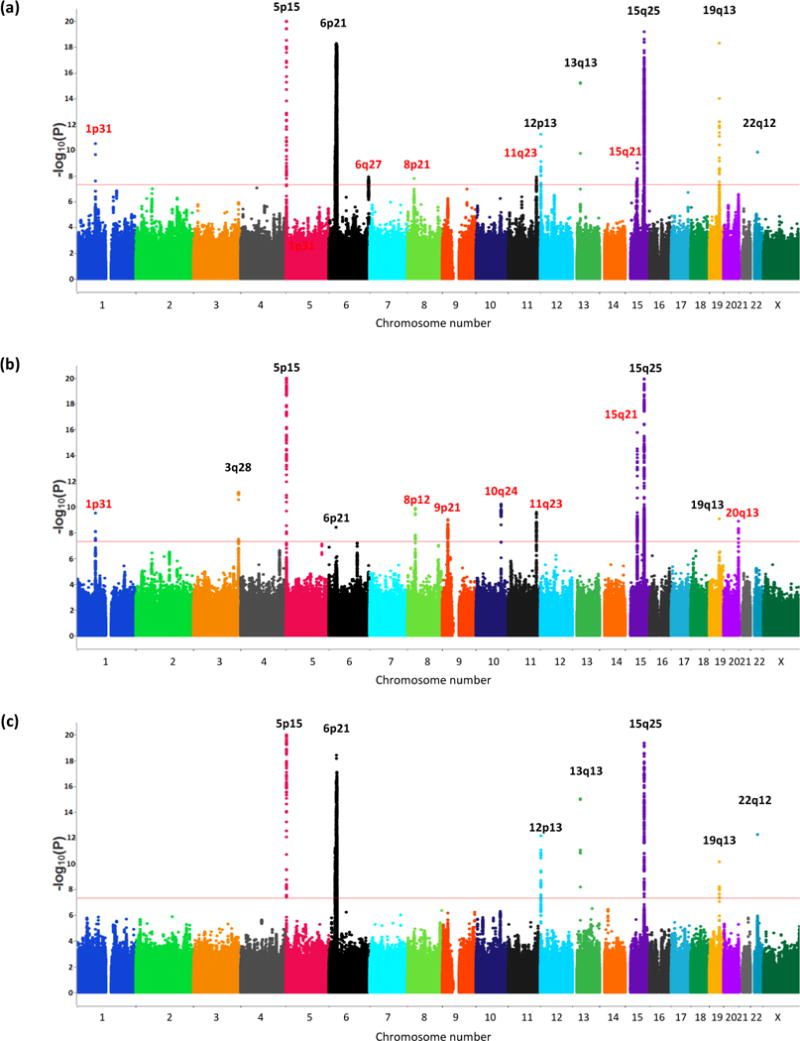
The study revealed ~21,000 SNPs that are associated with lung cancer with a fixed P-value <1x10^-5. The associations with loci and lung cancer varied according to histological subtypes, as shown in Figure 1. Figure 1 below shows A) overall lung cancer associations, B) associations with Adenocarcinoma, and C) associations with Squamous Cell carcinoma. 
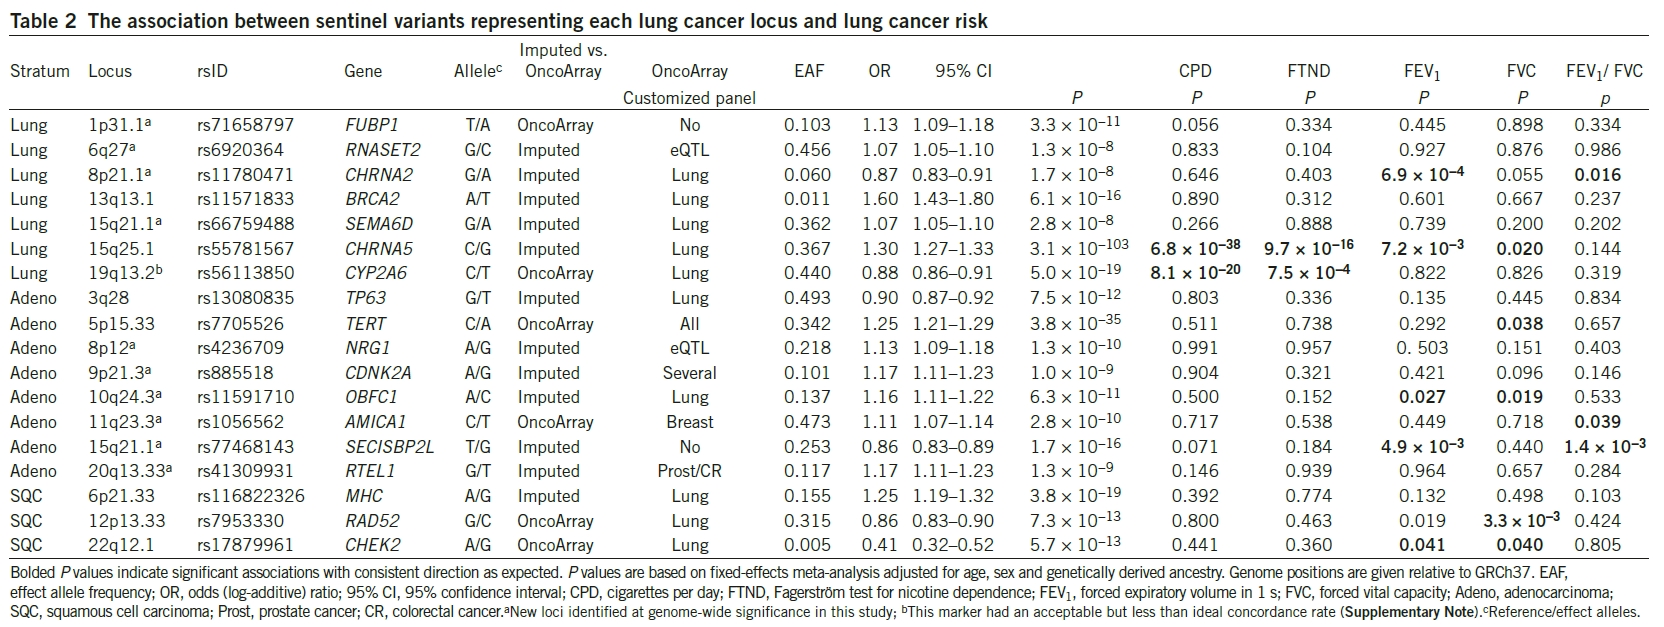
These were further narrowed to loci with a fixed P-value <5x10^-8, of which there were 18. 7 were associated with lung cancer overall, 8 were associated with adenocarcinoma, and 3 were associated with squamous cell carcinoma.

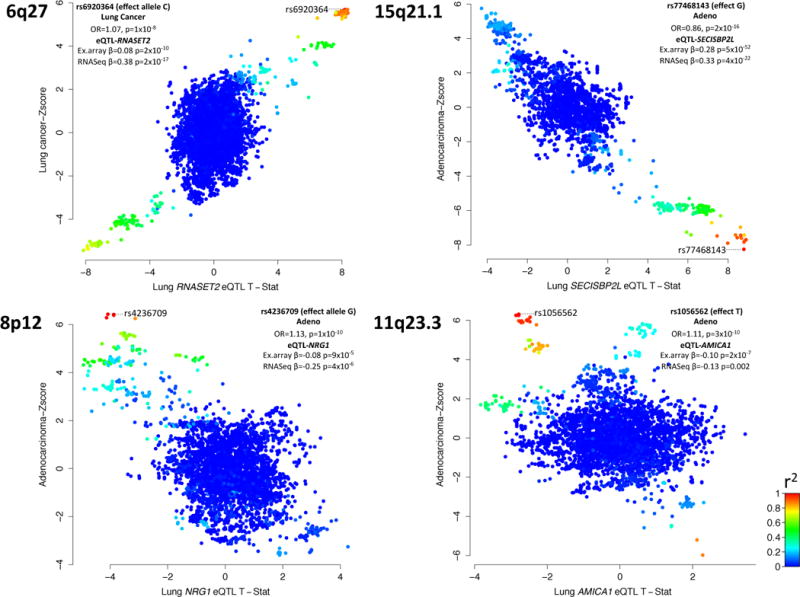
A further analysis of associated loci was presented in Figure 2. This part was very confusing to me, and it takes a bit of explanation.

From my understanding, each graph above represents a different position on the genome, such as 6q27. Each dot on the scatter plots represents a single SNP. The Y-axes represent lung cancer or adenocarcinoma Z-scores. What is the lung cancer Z-score? Within each gene loci are SNPs that have an odds ratio association with lung cancer. The Z-score is the odds ratio of each SNP, standardized to mean 0 and standard deviation of 1 according to the population of SNPs within each gene loci. For example, in Graph A, the SNP rs6920364 is highly associated with lung cancer, and has Z-score ~6, therefore is 6 std above the mean of the odds ratio compared to other SNPs within this same genome position.
The X-axes are even more confusing! They introduce an unfamiliar term - eQTL, which stands for expression of Quantitative Trait Loci. This term evaluates the question - to what extent are variations in these gene loci associated with different expression of a specific mRNA? In this case, we are evaluating the variations in each SNP to a variation in expression of mRNA of a nearby gene (e.g. RNASET2). This is measured in the form of a T-statistic, which is centered around 0 and has standard deviation of 1. For example, in Graph A, rs6920364 has T-statistic ~8, which represents a SNP variation that is highly associated with expression of the RNASET2 transcript.
To make matters more confusing, these graphs include colors, which represent the level of linkage disequilibrium between SNPs. I personally don’t yet see the relevance of adding LD values to these graphs. But LD is a topic for another day, and maybe then I’ll appreciate the need for the added colors.
In summary, Figure 2 shows a selection of the chosen loci which are highly associated with lung cancer, or histological subtypes of lung cancer. In addition, it shows that these loci are highly associated with variations in nearby mRNA expression, which may demonstrate a hypothetic causal relation to their statistical significance.
Discussion and limitations
This study identified 18 loci that were associated with overall lung cancer risk or risk of Adenocarcinoma or Squamous Cell lung cancer. The genetic susceptibility alleles explain approximately 12.3% of the familial relative risk previously reported in family cancer databases.
This study doesn’t describe any limitations within the paper, and my knowledge of GWAS studies is not strong enough yet to identify specific concerns. Limitations TBD!
Take home points
There are 18 SNPs highly associated with lung cancer. Their variations may lead to altered gene expression, which may explain changes in phenotypes. The SNPs that were identified were the following:
- rs71658797
- rs6920364
- rs11780471
- rs11571833
- rs66759488
- rs55781567
- rs56113850
- rs13080835 (Adenocarcinoma)
- rs7705526 (Adenocarcinoma)
- rs4236709 (Adenocarcinoma)
- rs885518 (Adenocarcinoma)
- rs11591710 (Adenocarcinoma)
- rs1056562 (Adenocarcinoma)
- rs77468143 (Adenocarcinoma)
- rs41309931 (Adenocarcinoma)
- rs116822326 (Squamous cell carcinoma)
- rs7953330 (Squamous cell carcinoma)
- rsl7879961 (Squamous cell carcinoma)
